
Quantitative Reasoning with Data
Real data. Real models. Real decisions.
Math for the world students live in.
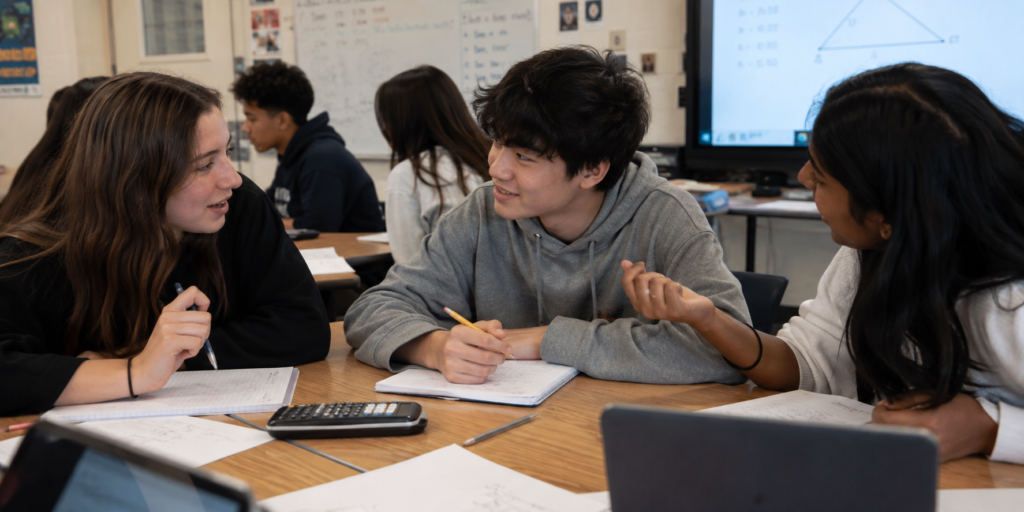
Quantitative Reasoning with Data (QRD) is a third- or fourth-year high school mathematics course that brings together two growing pathways: quantitative reasoning and data science. Designed for students pursuing careers in health, business, education, the trades, social sciences, and the arts, and for any student who wants math they can use to understand and shape their world.
Across nine modules, students work with real data on questions about money, technology, climate, health, and equity. They move through the full modeling cycle: defining problems, building and testing models, and communicating findings to real audiences.
Every unit reflects four core design principles that shape students’ learning experiences.
Context Forward
Every module lives in the real world. Each module is grounded in a context from the world students live in: their money, their health, their technology, their planet, their community. Contexts come from what students told us they care about, and the math grows out of the need to understand and act on them.
Modeling at the Center
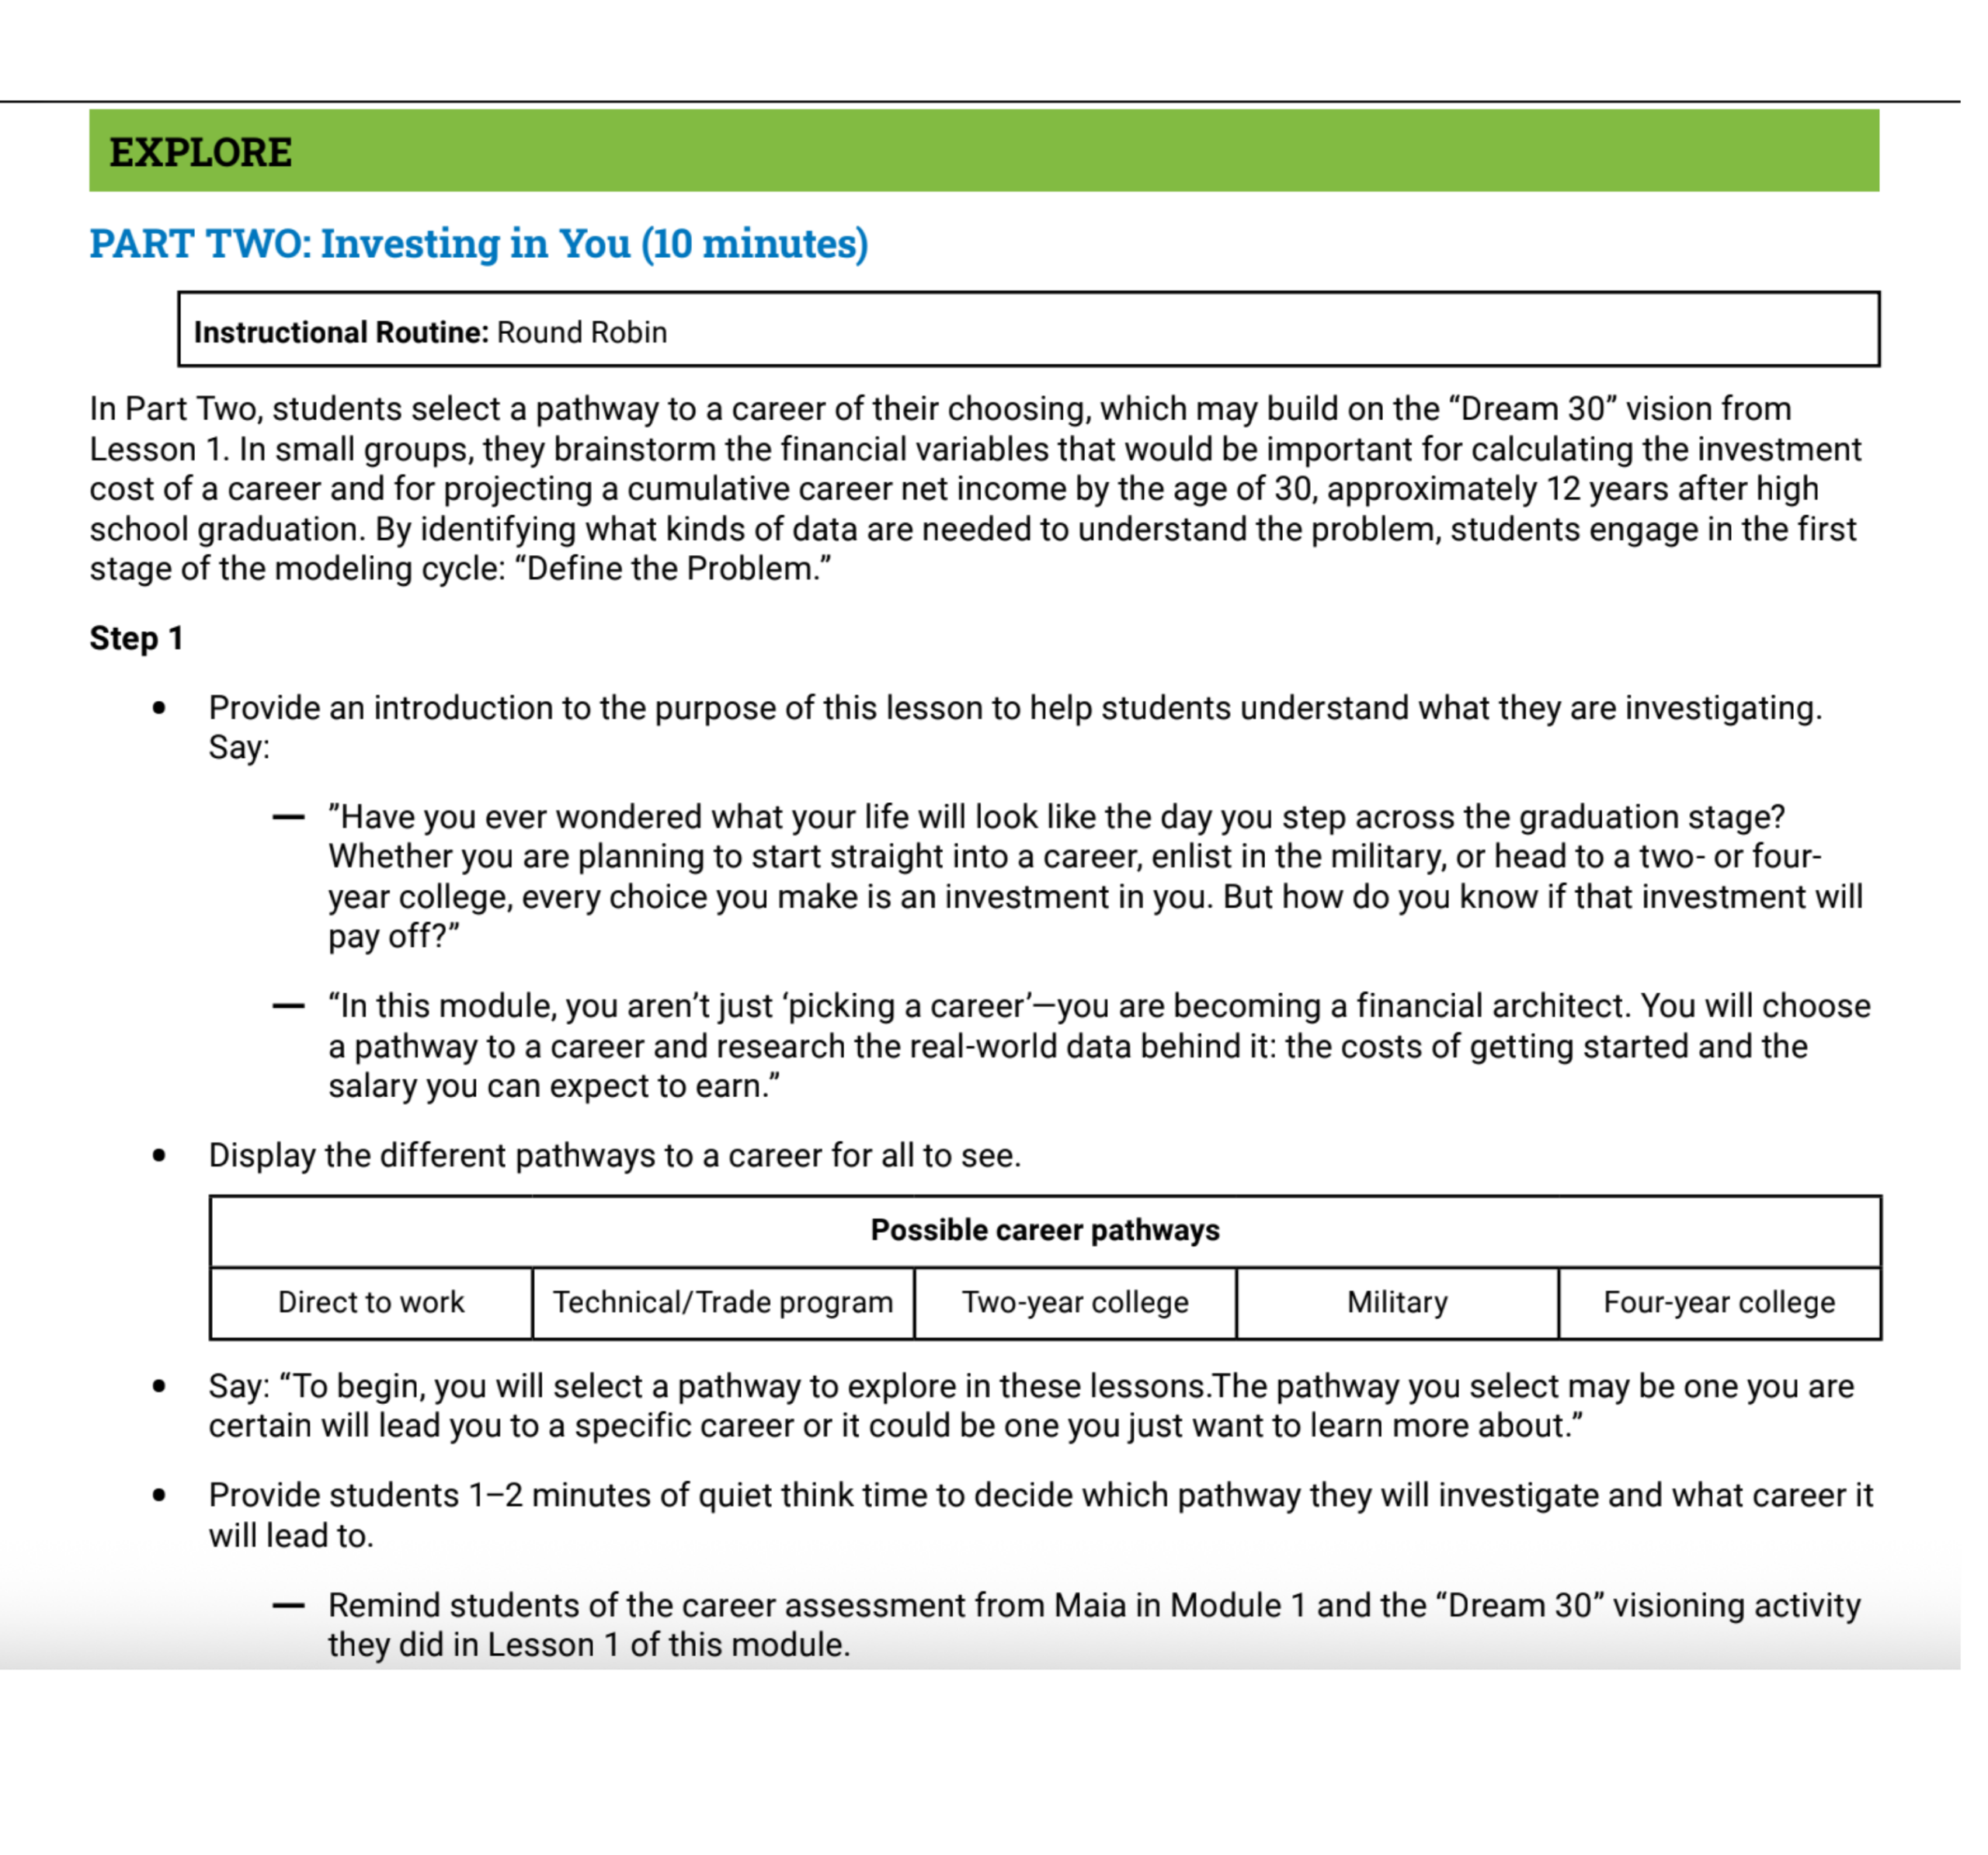
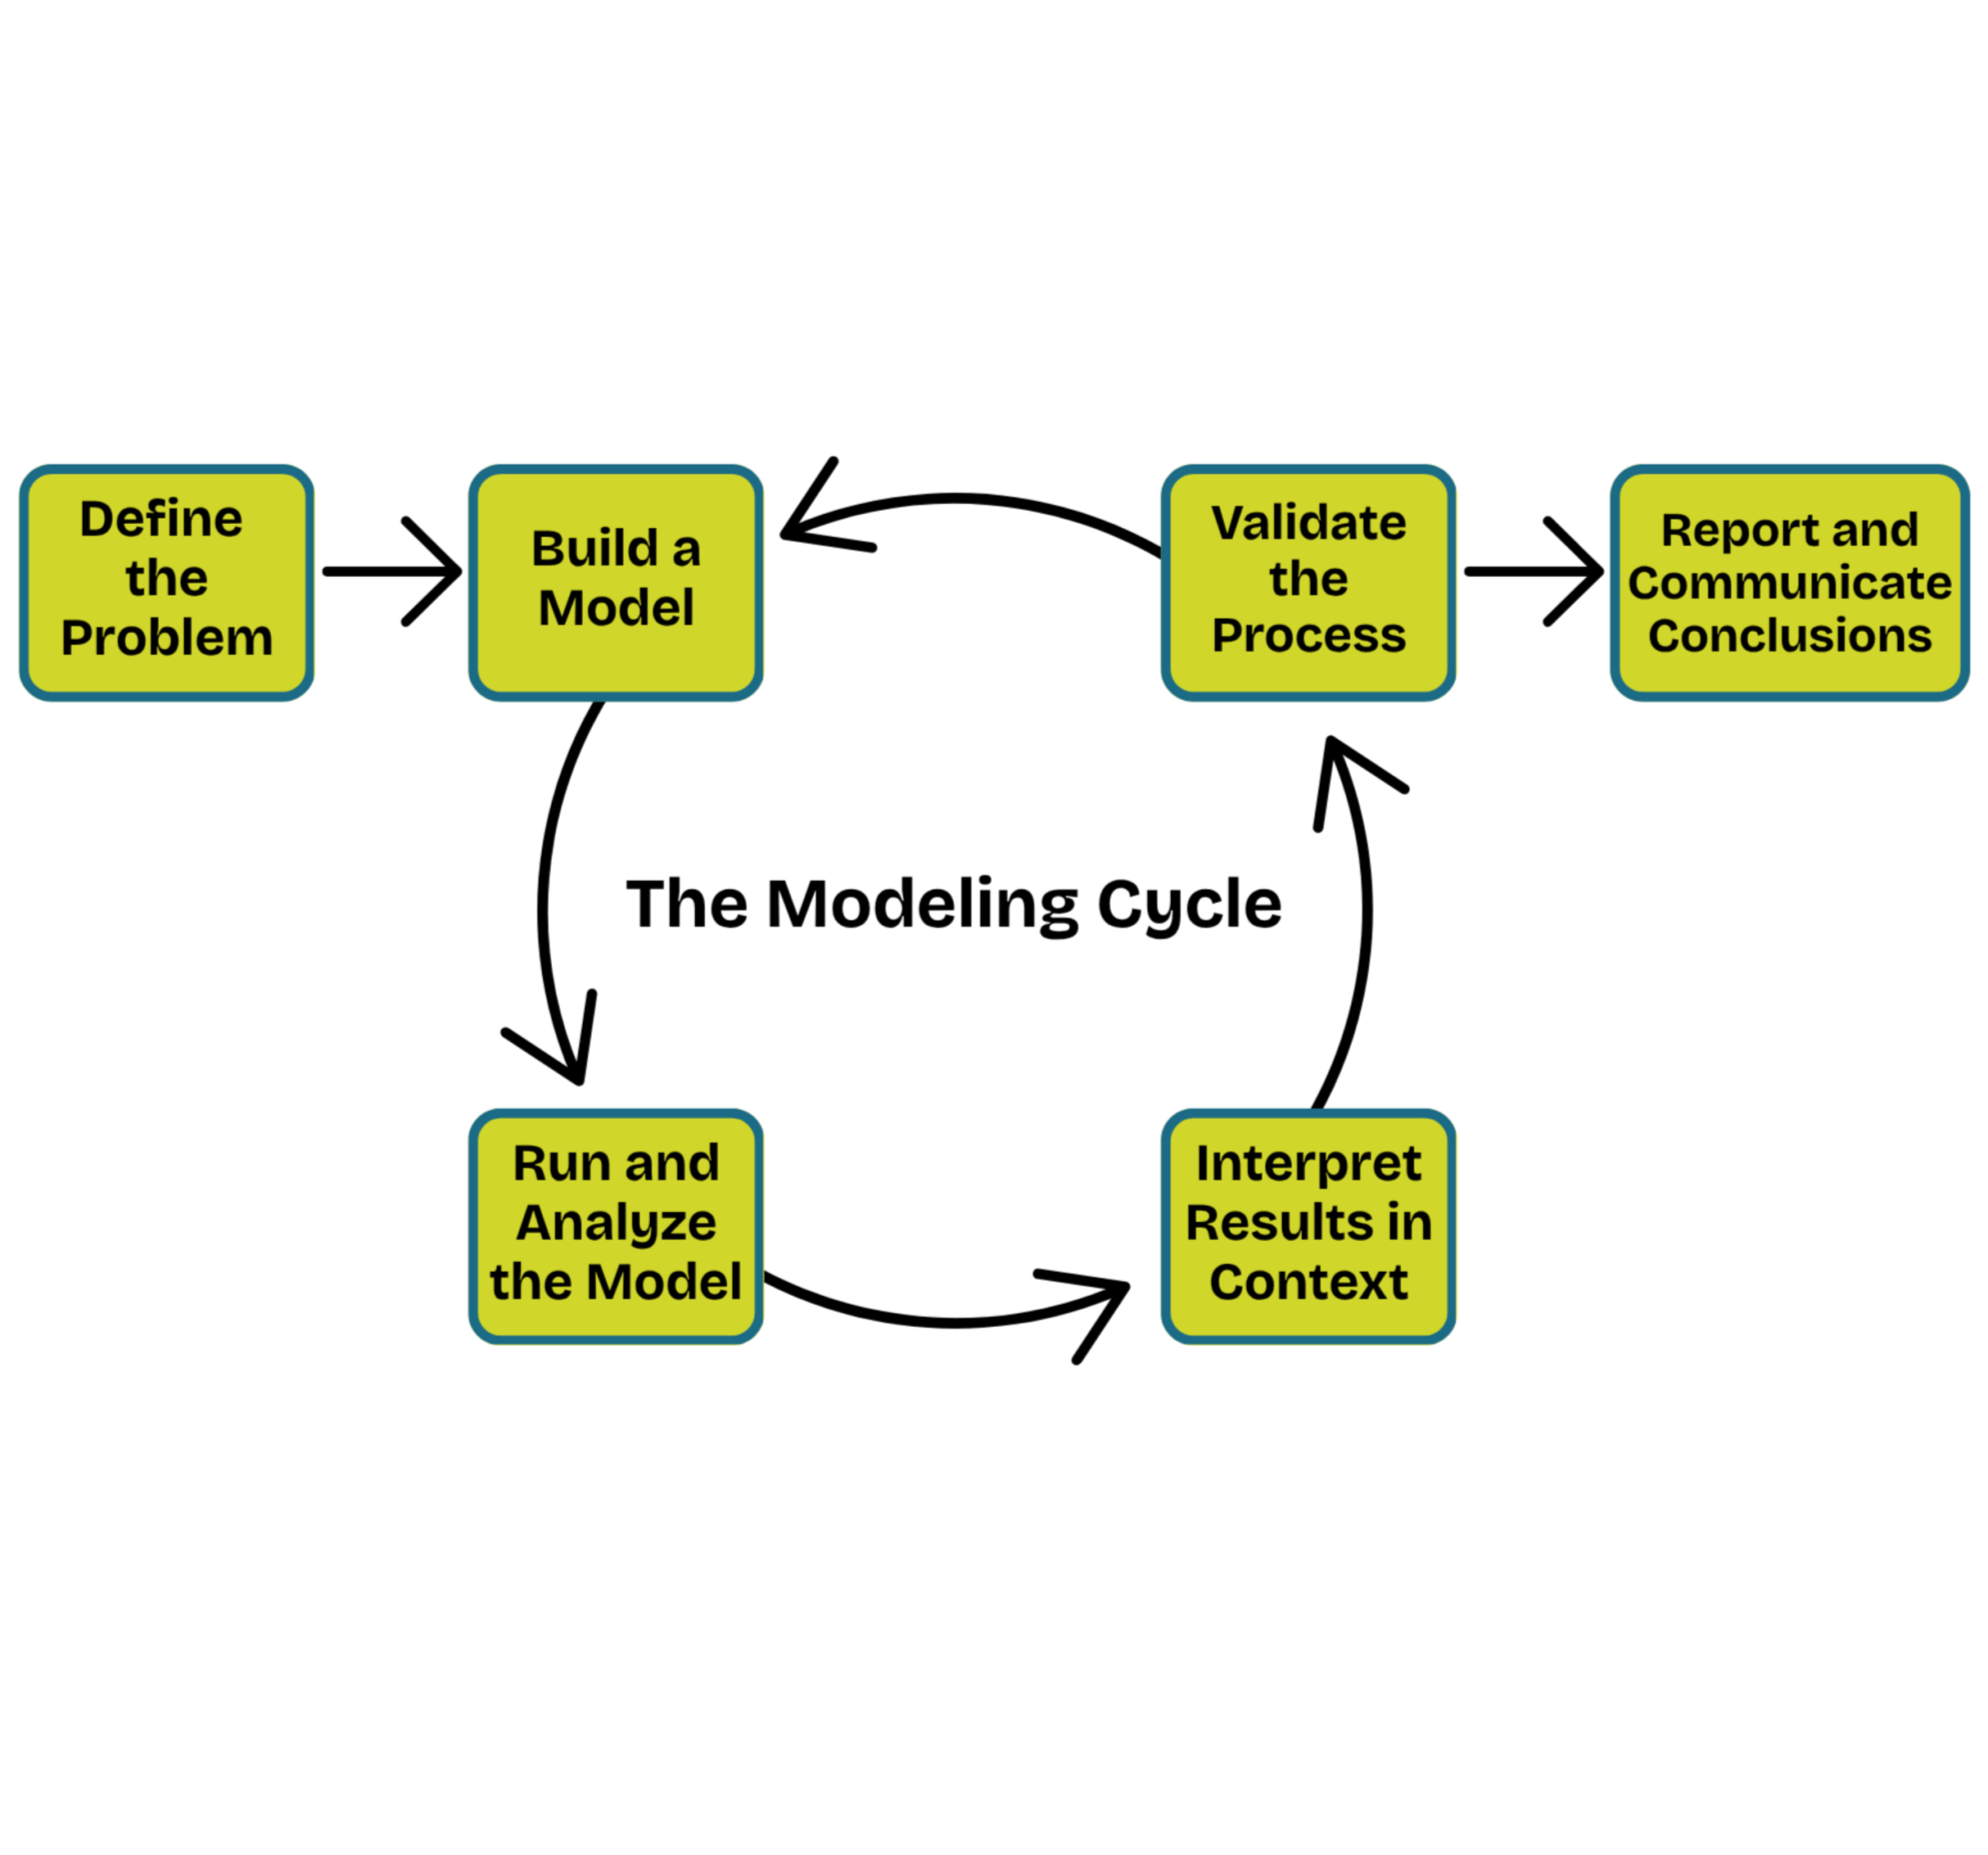
Work like a modeler. Students work through the full modeling cycle: defining a problem, building and running a model, interpreting results in context, validating their process, and reporting findings. Over the year, they take on more of the cycle themselves until they can carry an investigation from start to finish.
Data as a Tool for Agency
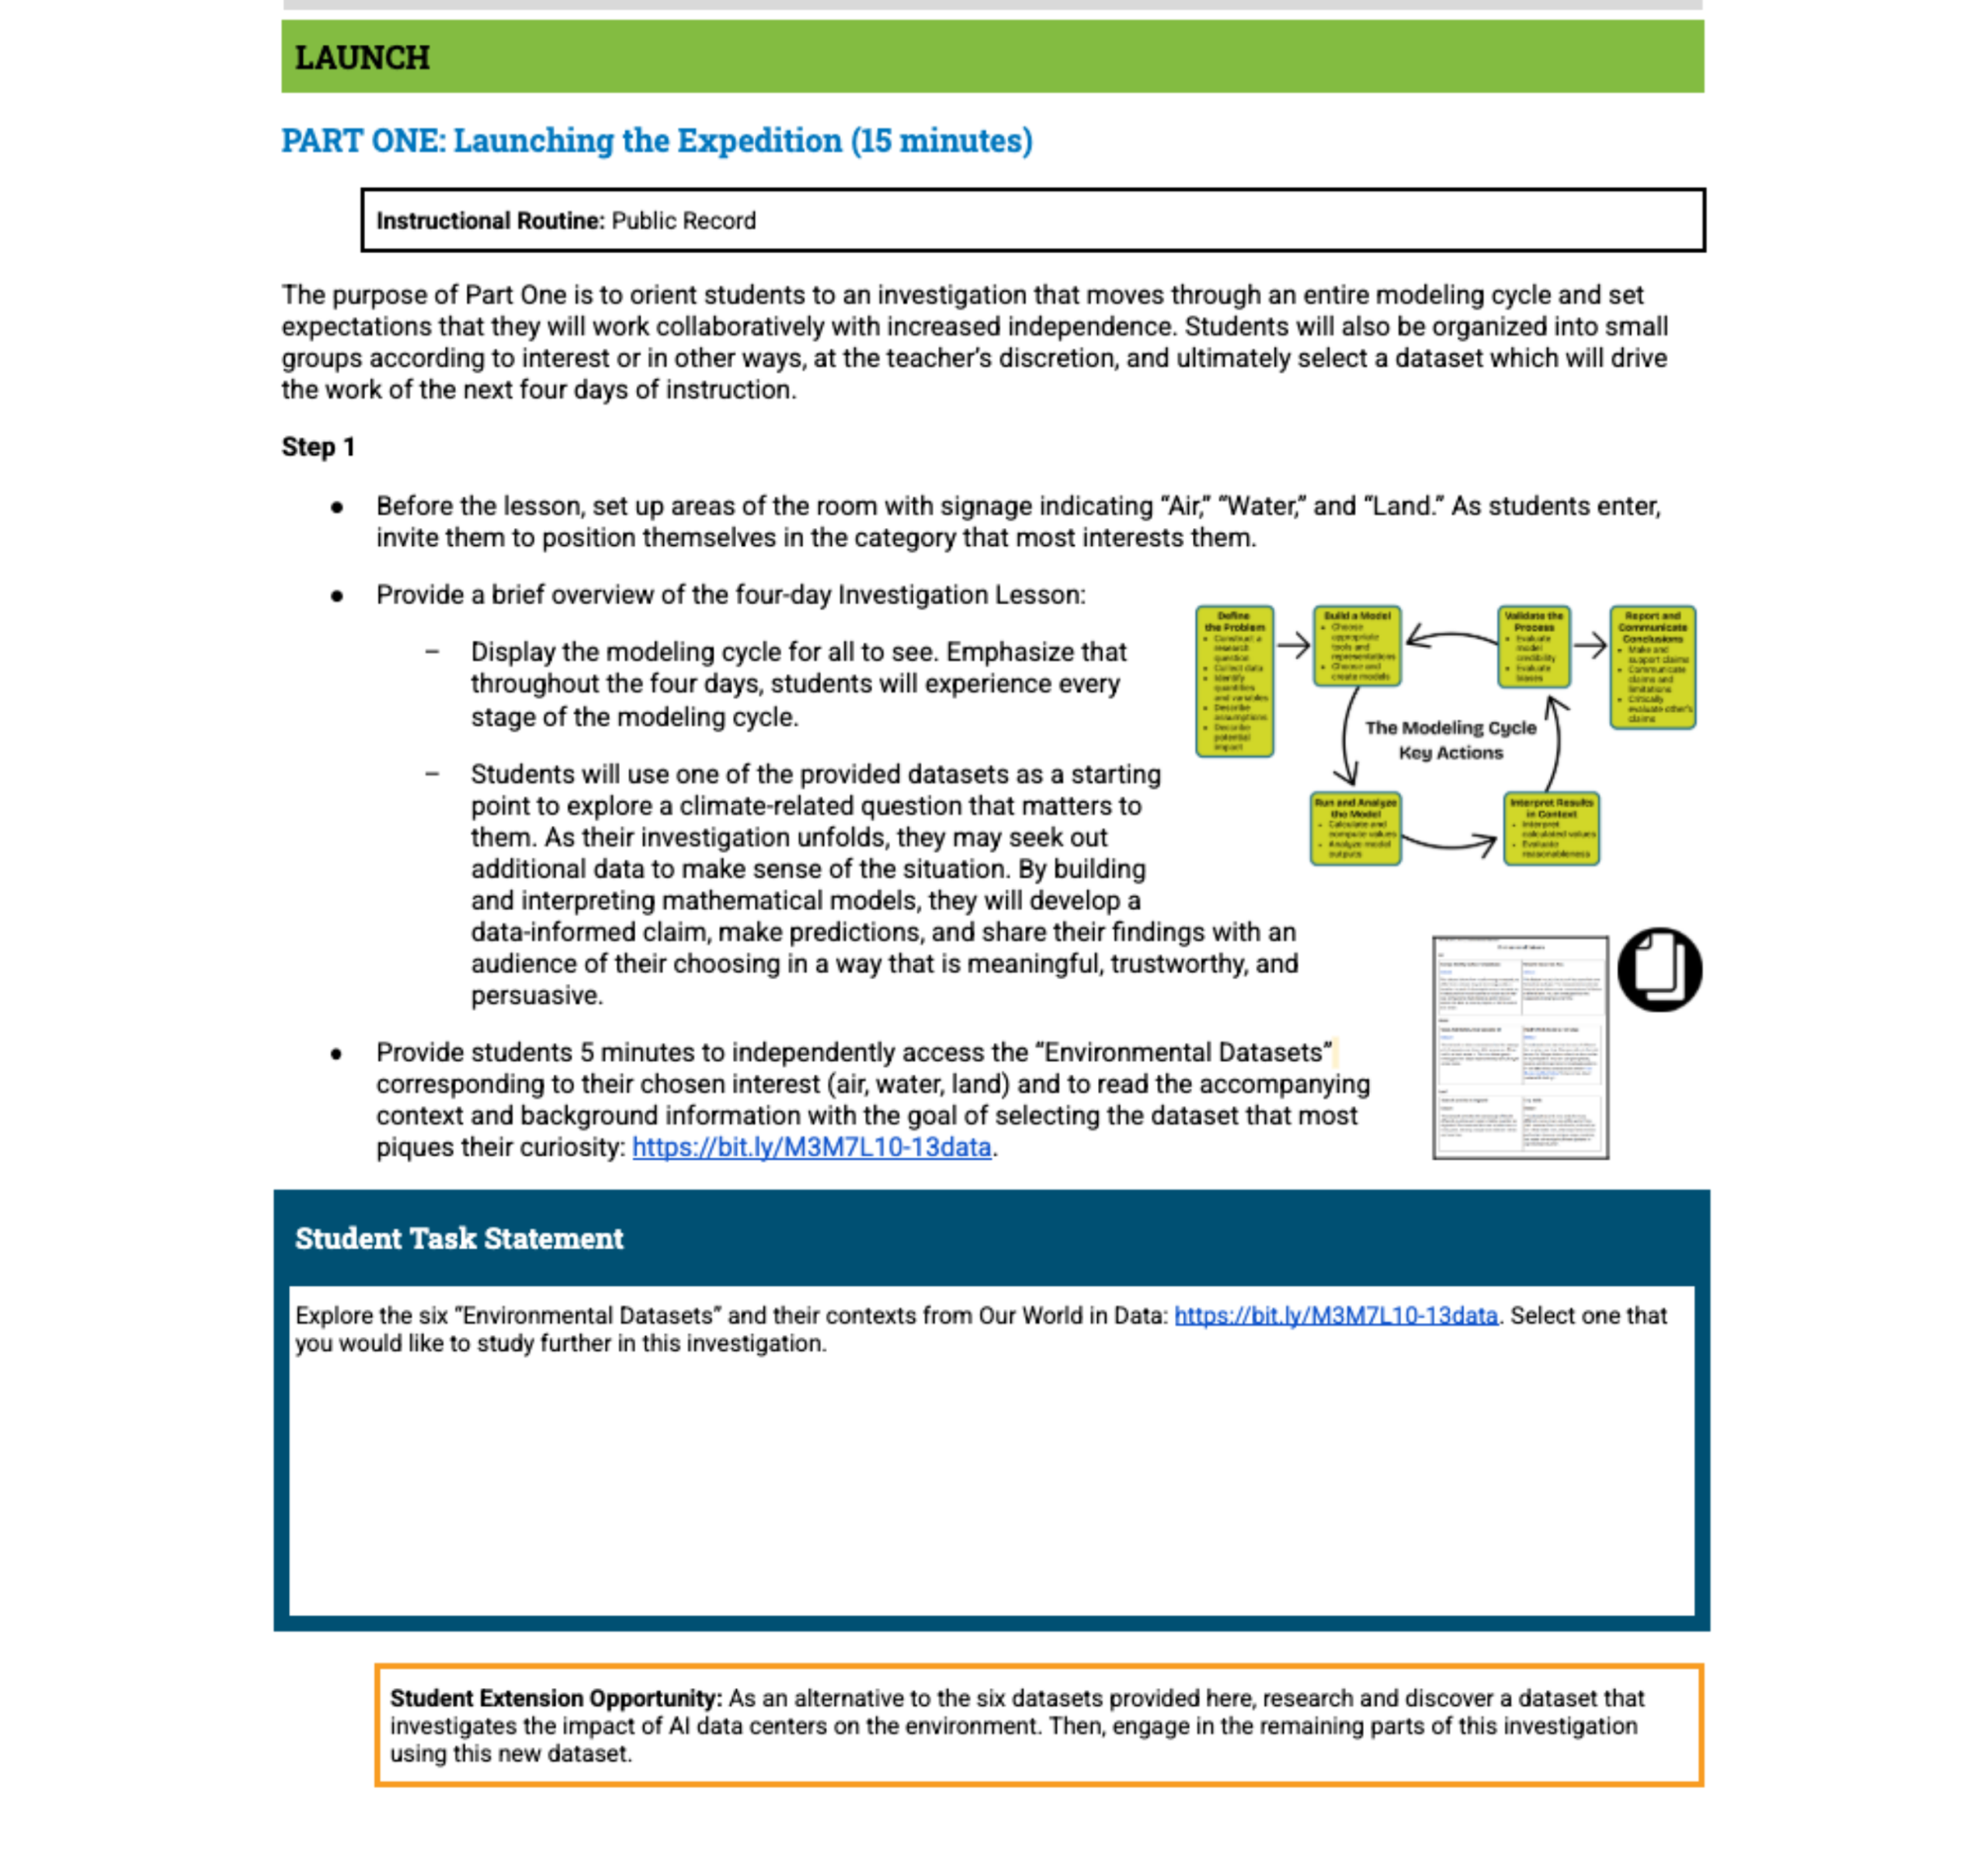
Be a change maker. Students work with real public datasets on health, climate, the economy, and their communities. They learn to question data sources, spot bias, and use evidence to make and defend decisions. The year ends with students investigating an inequity they choose and making a case for action.
Depth with Relevance
Build skills in context and in concert. QRD develops procedural fluency, algebraic thinking, statistical reasoning, and quantitative communication together. Students revisit familiar content in more complex settings. The course is demanding by design provides students with the critical thinking needed to take on the next math course in their sequence.
Where Does QRD Fit in My District?
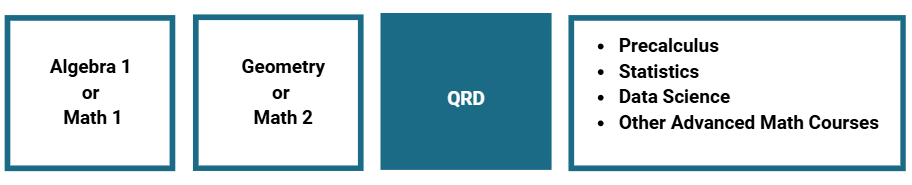
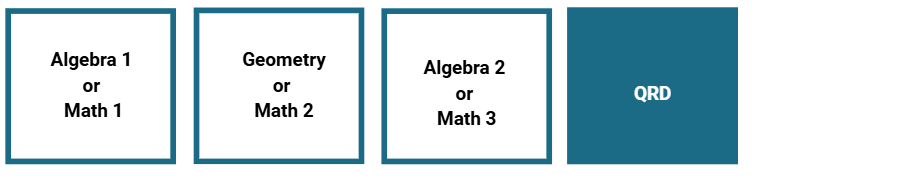
Originally developed with Denver Public Schools, QRD is available to districts beginning in 2027-28 as a core course or as an option alongside Algebra 2, Precalculus, Statistics, or Calculus.

Alternative to existing upper-level mathematics course.

As an additional third- or fourth-year mathematics option.

An elective for interested students
Potential Course Sequences
Sequence 1
Sequence 2
Math that Aligns with Post-Secondary Goals
Real-World Skills
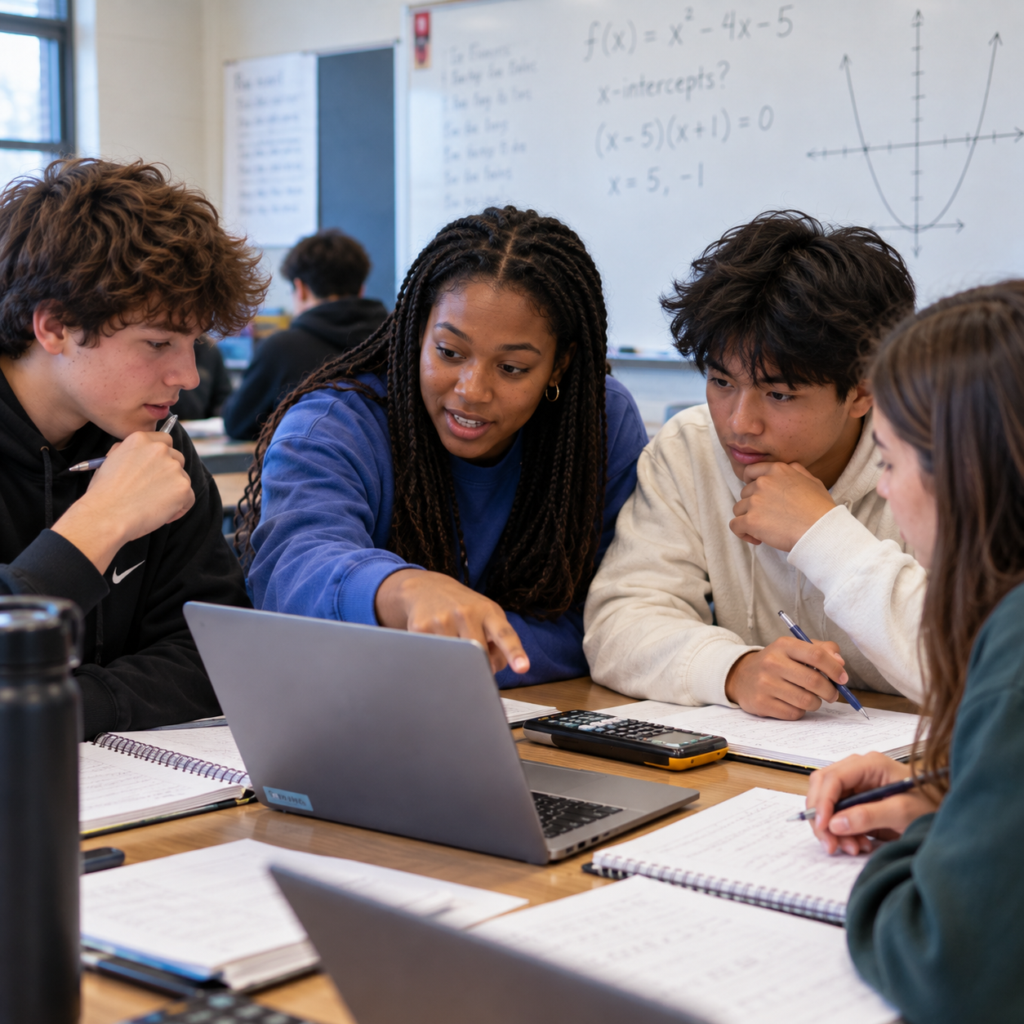
Today’s students will enter colleges, careers, and communities awash in data. They’ll need to evaluate evidence, interpret risk, recognize misleading claims, build models, communicate quantitative arguments, and make decisions under uncertainty. The course helps students build durable skills such as communication, leadership, fortitude, collaboration, and creativity through application of math concepts. QRD is rigorous math built for the decisions students will face after high school.
More At-Bats with Critical Concepts
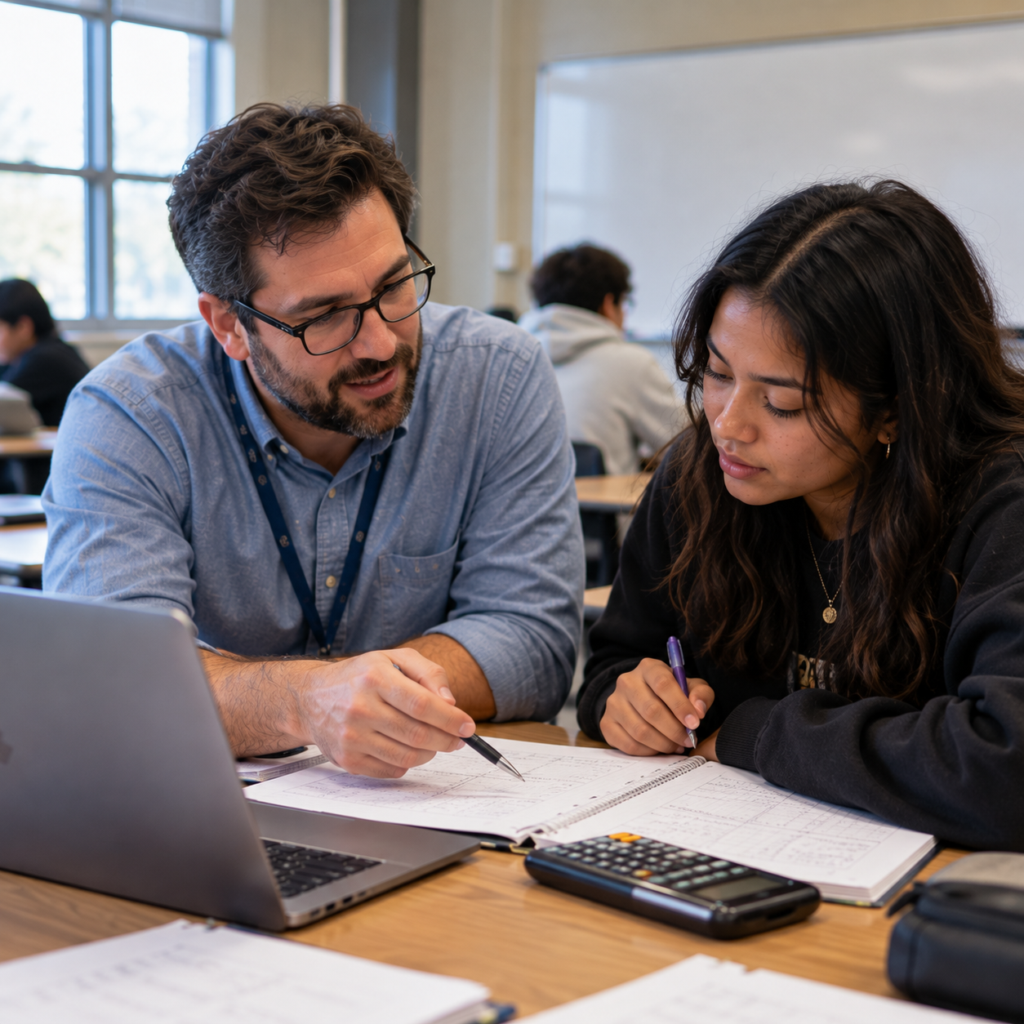
QRD allows for reinforcement of critical concepts from middle school, Algebra, and Geometry. It isn’t a remedial course, but offers a deepening of the skills most in-demand in college and careers through more sophisticated and complex uses.
Serious math, used for a purpose
In QRD, students will explore real life applications of advanced mathematical skills and concepts, including:
- Recognition of common function types and the mathematical behavior of those functions as they are interpreted and transformed.
- Skill with multiple technologies to understand and apply functions to model and make sense of real-world phenomena.
- Flexible and appropriate use of solution techniques for linear equations and inequalities, nonlinear equations and inequalities, and systems of equations and inequalities.
- Deepened understanding of quantities, ratios, rates, proportions, and percentages to investigate and solve problems in authentic contexts.
- Critical literacy with statistical data, data displays, and claims that describe and predict things about our world.
- Comparison of data distributions to draw conclusions about groups and outcomes.
- Use of models and data to make predictions and judge how much confidence those predictions deserve.
- Evaluation of the reliability and trustworthiness of models and data sources, including how bias shapes results.
- Use of probability to represent and interpret outcomes and to make decisions under uncertainty.
- Interpretation of absolute risk, relative risk, and percent change to evaluate claims about risk.
- Application of properties of circles, arcs, sectors, solids, and cross-sections to solve 2D and 3D modeling problems.
- Independent use of the full modeling cycle, from defining a problem and building a model to validating results and reporting findings.
- Selection and justification of mathematical approaches best suited to a problem.
- Communication of quantitative findings to different audiences using words, visuals, and data.
Explore the course
Core Lessons
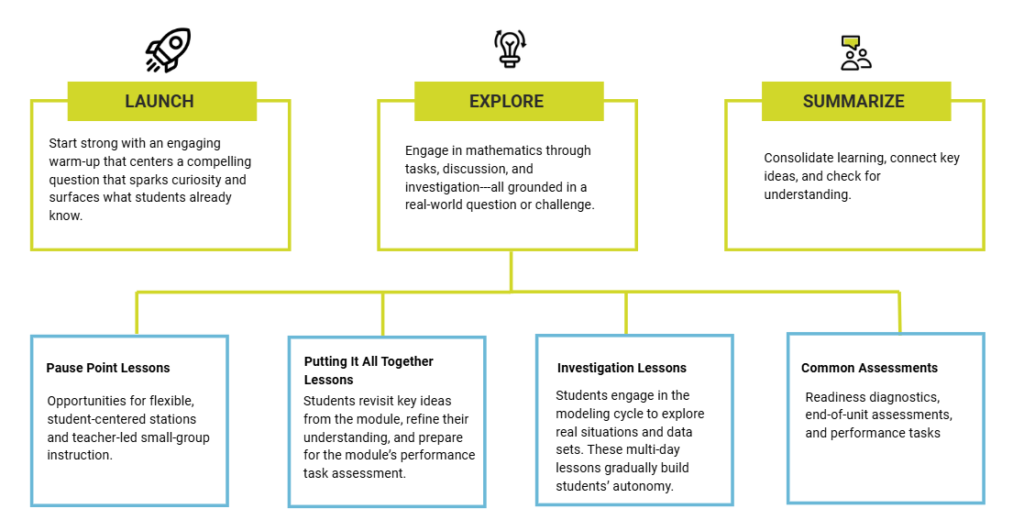
These lessons comprise the main instructional time for the unit and cover the course-level standards aligned to the unit. Each lesson follows a consistent design:
Features Designed for Teacher and Student Success

Embedded Practices for Increasing Access

Responsive Strategies

Supports for Multilingual Learners
Embedded Instructional Routines

Thought-provoking Student Tasks and Activities

Teacher and Student Reflection Questions

Practice Problems

Student-Facing Lesson Summaries and Glossaries

Student Portfolios
Preview a lesson
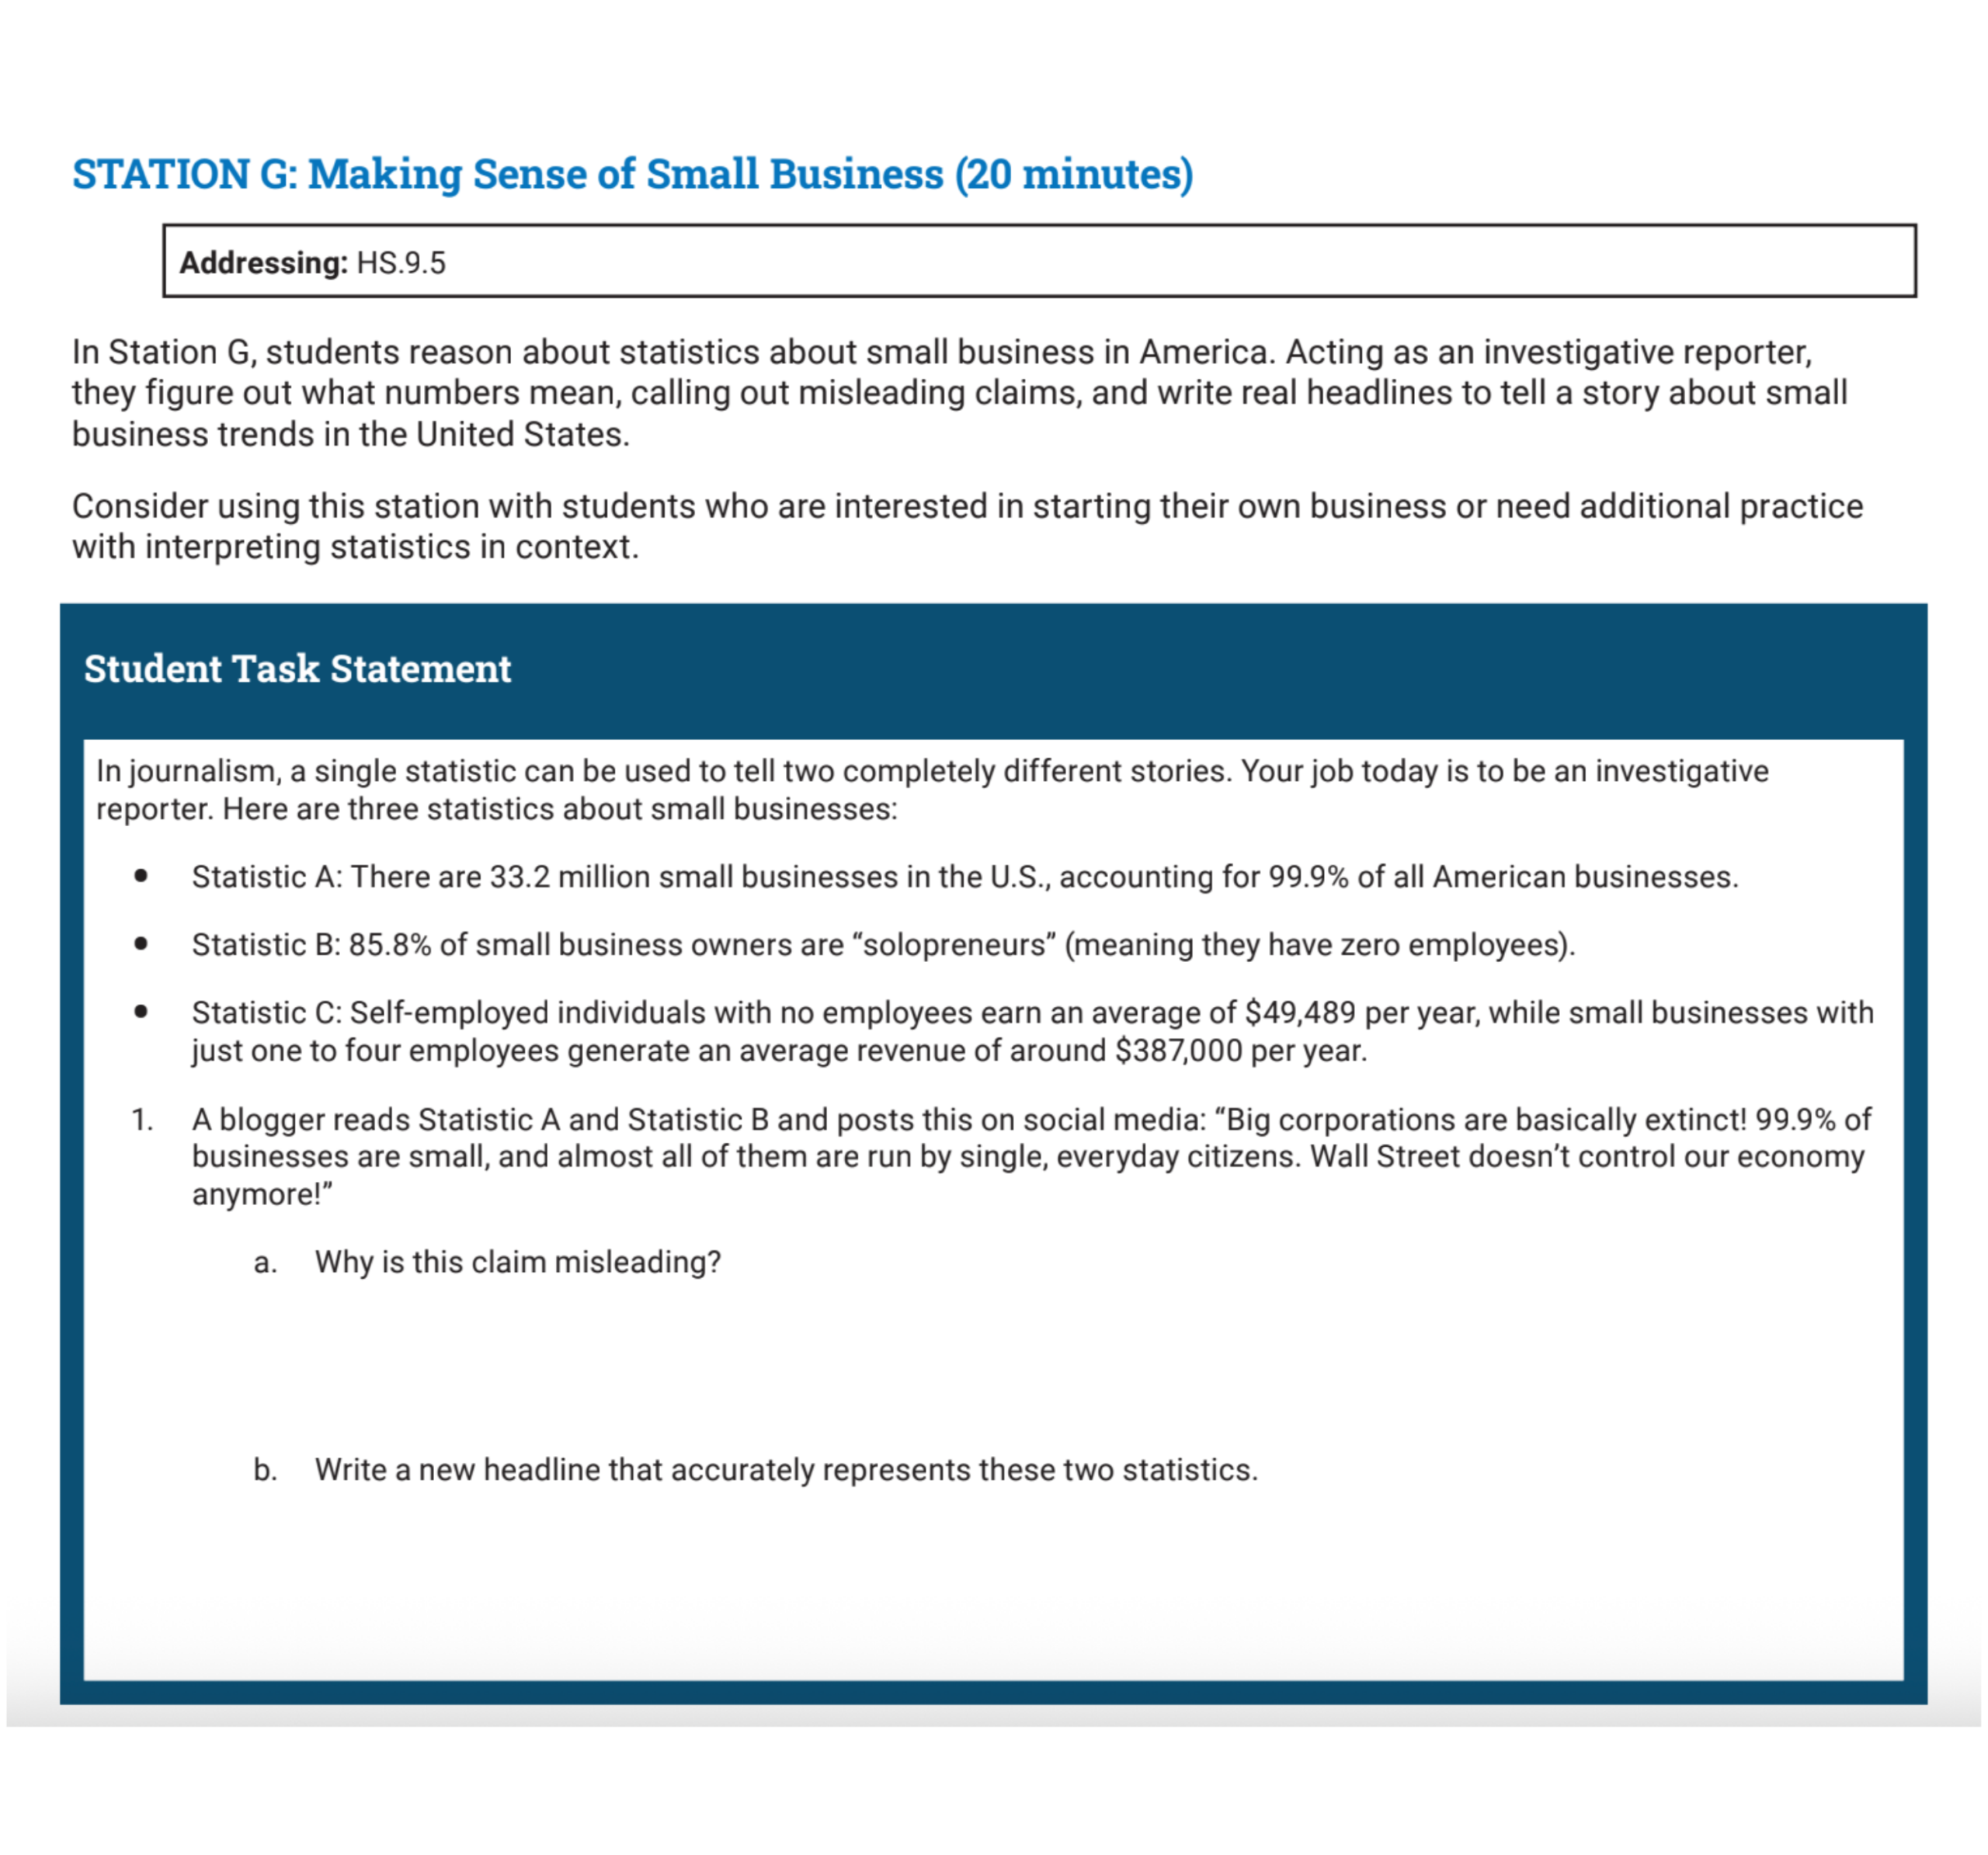
Comparing Profitability in a Business
Students step into the role of a small business owner as they sort a photographer’s real-looking receipts and invoices, build a profit and loss model in a spreadsheet, and use it to forecast future months. Students reason about categorizing messy data, writing spreadsheet formulas, comparing profitability across services, and making a business recommendation backed by evidence from their own model.


Investigating Community Needs, Designing Outdoor Spaces
Students engage in the full modeling cycle as they design an outdoor space responsive to the needs of a community. Students reason about sampling, representation, and survey design, critiquing the adequacy of data, and ultimately producing a geometric blueprint of their new space.

Introduction to Pathways and QRD
You might be wondering…
QRD is a third- or fourth-year high school mathematics course for students who want to use math to understand and act on the world around them. It serves students headed toward a wide range of futures, including health, business, education, the trades, the social sciences, and the arts. Districts can offer it as a core course for all students or as an option alongside Precalculus, Statistics, and Calculus.
Yes. Students revisit and extend algebra, geometry, and statistics in complex, real-world settings, and they carry full modeling investigations from start to finish. Many lessons include extensions that let students go deeper into the mathematics at hand.
QRD works as an alternative to Algebra 2 or Math 3, or as a fourth-year course. In Denver Public Schools, it counts as the Math 3 equivalent and is the core third-year course for every student. Students who complete QRD can go on to Precalculus.
QRD has been submitted for NCAA approval. Because it extends students’ work with linear, exponential, and quadratic functions, it is designed to meet the expectations of a third-year college preparatory math course. We recommend districts confirm requirements with their state university systems.
QRD prepares students for the gateway courses many majors require, including introductory statistics, quantitative reasoning, and data science. Students who want to pursue a STEM path can continue to Precalculus.
QRD prepares students for the gateway courses many majors require, including introductory statistics, quantitative reasoning, and data science. Students who want to pursue a STEM path can continue to Precalculus.
Students show what they know through performance tasks, end-of-unit assessments, exit tickets, and a portfolio that grows across the year. Built-in Pause Point and Putting It All Together lessons give teachers time to check progress and support students in small groups before assessments.
Professional learning is part of a QRD implementation. Coherent Math works with each district to design support that fits its teachers, timeline, and goals.
Students use CODAP, the Desmos graphing and geometry calculators, Amplify Desmos Activity Builder, spreadsheets, Google Slides, and AI chatbots, used criticality and responsibly. The course assumes 1:1 student devices.
QRD was written to Colorado’s new state mathematics standards. Coherent Math offers custom alignment for other states and can work with your district to map QRD to local graduation requirements.
Reach out to schedule a conversation. We’ll learn about your current course offerings and goals, and talk through what a launch or pilot could look like in your district.